Prepared by Haven Algo Licensing Ltd  ·  Data source: IC Markets (EU) Ltd  ·  Developer-Attested API Record · Not independently audited
Trading Dashboard
Private access — principals only
 
X45 EA / IC MARKETS (ref: Theo)
Account 11135157 · USD · Real
Feb 2024 – Nov 2025
4,999 trades
Time-Weighted Return (TWR)
+85.01%
Deposit-adjusted · strategy performance basis
Money-Weighted Return (MWR)
+61.82%
$4,761 net P&L across staged capital contributions totaling $7,700
Annual Return (CAGR)
+42.13%
MWR annualised · 1.77yr live window
Net P&L (after costs)
+$4,761
Across staged capital contributions totaling $7,700
Win rate
74.51%
3,706 / 4,999 trades
Sharpe ratio
1.99
Annualised · all volatility
Sortino ratio
3.09
Annualised · downside only
Max drawdown
-16.73%
Sep 2024 · closed-balance basis
Profit factor
1.55
Gross profit ÷ gross loss
Best month
+53.82%
Feb 2024
Positive months
89.5%
17 of 19 active months
Max consec. negative months
1
Single month maximum
Payoff ratio
0.50
Avg win ÷ avg loss · 74% WR compensates
VaR 95% (daily)
+0.05%
95% of trading days positive or better
CVaR 95% (daily)
-5.21%
Avg loss · worst 5% of trading days
Recovery factor
3.01
Net profit ÷ max drawdown ($)

Capital Contributions
Total capital contributions (developer-attested)$7,700
Initial contribution$250 · 06 Feb 2024
Subsequent contributions$7,450 across multiple deposits
Final account close13 Nov 2025
Live account funded through multiple capital contributions totaling $7,700; performance metrics are evaluated using Time-Weighted Return (TWR) to neutralize the effect of external cash flows.

The presence of multiple deposit events across the deployment period is why TWR (+85.01%) and MWR (+61.82%) differ. TWR strips out the timing effect of each contribution to isolate pure strategy performance. MWR reflects the actual investor dollar experience. Both are sourced from the IC Markets (EU) developer API feed for account 11135157. Developer-attested. Not independently audited or verified by a third party.
September 2024 Stress Event
Maximum drawdown of 16.73%–16.73% was fully recovered within approximately two months.

Historical Recovery Statistics
Longest underwater period: 248 days
Average recovery period: 171 days

Underwater duration measures the time required to exceed a prior equity high and should not be interpreted as the recovery period from any single drawdown event.
Observed Dataset — Trading Activity
The live observation window ran from 06 Feb 2024 to 13 Nov 2025. Within this period, three months of trading inactivity are recorded (Nov 2024, Dec 2024, Jan 2025) — the EA was paused during this window. This is faithfully reflected in the monthly heatmap as observed data.

All performance metrics are computed from the continuous live trade data outside the observed pause window.
IC Markets EU · Account 11135157 · Feb 2024 – Nov 2025 · Not independently audited · Past performance is not indicative of future results.
Note — Sep 2024: The monthly return of −17.13% and the max drawdown of −16.73% are different calculations. Monthly return measures open-to-close P&L for the calendar month. Max drawdown measures the worst equity peak-to-trough within the full observation window — these figures will not always align and both are correct.
Month Return Net P&L
Loading…
All risk metrics derived from Developer-Attested API Record · IC Markets EU · Account 11135157 · Not independently audited · Past performance is not indicative of future results.
Drawdown Metrics
Max observed drawdown16.73%
EventSep 2024
RecoveryFull · within 2 months
Longest underwater period248 days
Average underwater period171 days
Risk-Adjusted Returns
Sharpe ratio1.99 (annualised · full window)
Sortino ratio3.09 (annualised · full window)
Calmar ratio2.00 (CAGR ÷ max DD)
Recovery factor3.01 (net profit ÷ max DD $)
VaR 95% (daily)+0.05%
CVaR 95% (daily)-5.21%
Payoff ratio0.50 · compensated by 74% WR
Statistical Distribution — Computed
Active months—
Mean monthly return—
Median monthly return—
Std dev (monthly returns)—
Skewness—
Z-score · Sep 2024 (worst month)—
Win-rate Z-score vs 50% null—
Non-Custodial Principal Controls
Capital pooledNever
Account ownershipPartner's named account
Withdrawal rightsRetained by partner
EA operates onPartner's own MT5
Broker regulationCySEC · IC Markets EU
Licence Structure
HavenAlgo roleTechnology licensor only
No management authorityConfirmed
No pooled fundConfirmed
Regulatory framingEA software licence
JurisdictionLegal jurisdiction England & Wales · tax-efficient locations available if desired
All trade data sourced from a live IC Markets developer API feed. Attested by the EA developer. Not independently audited or verified by a third party. Past performance is not indicative of future results.
Open Close Symbol Type Lots P&L
Loading trade record…

X45 confirmed to scale $1M–$50M across three execution cost scenarios. Execution quality — measured across 4,957 live TP exits from the Developer-Attested IC Markets API record — holds materially from minimum to maximum modelled capital level.
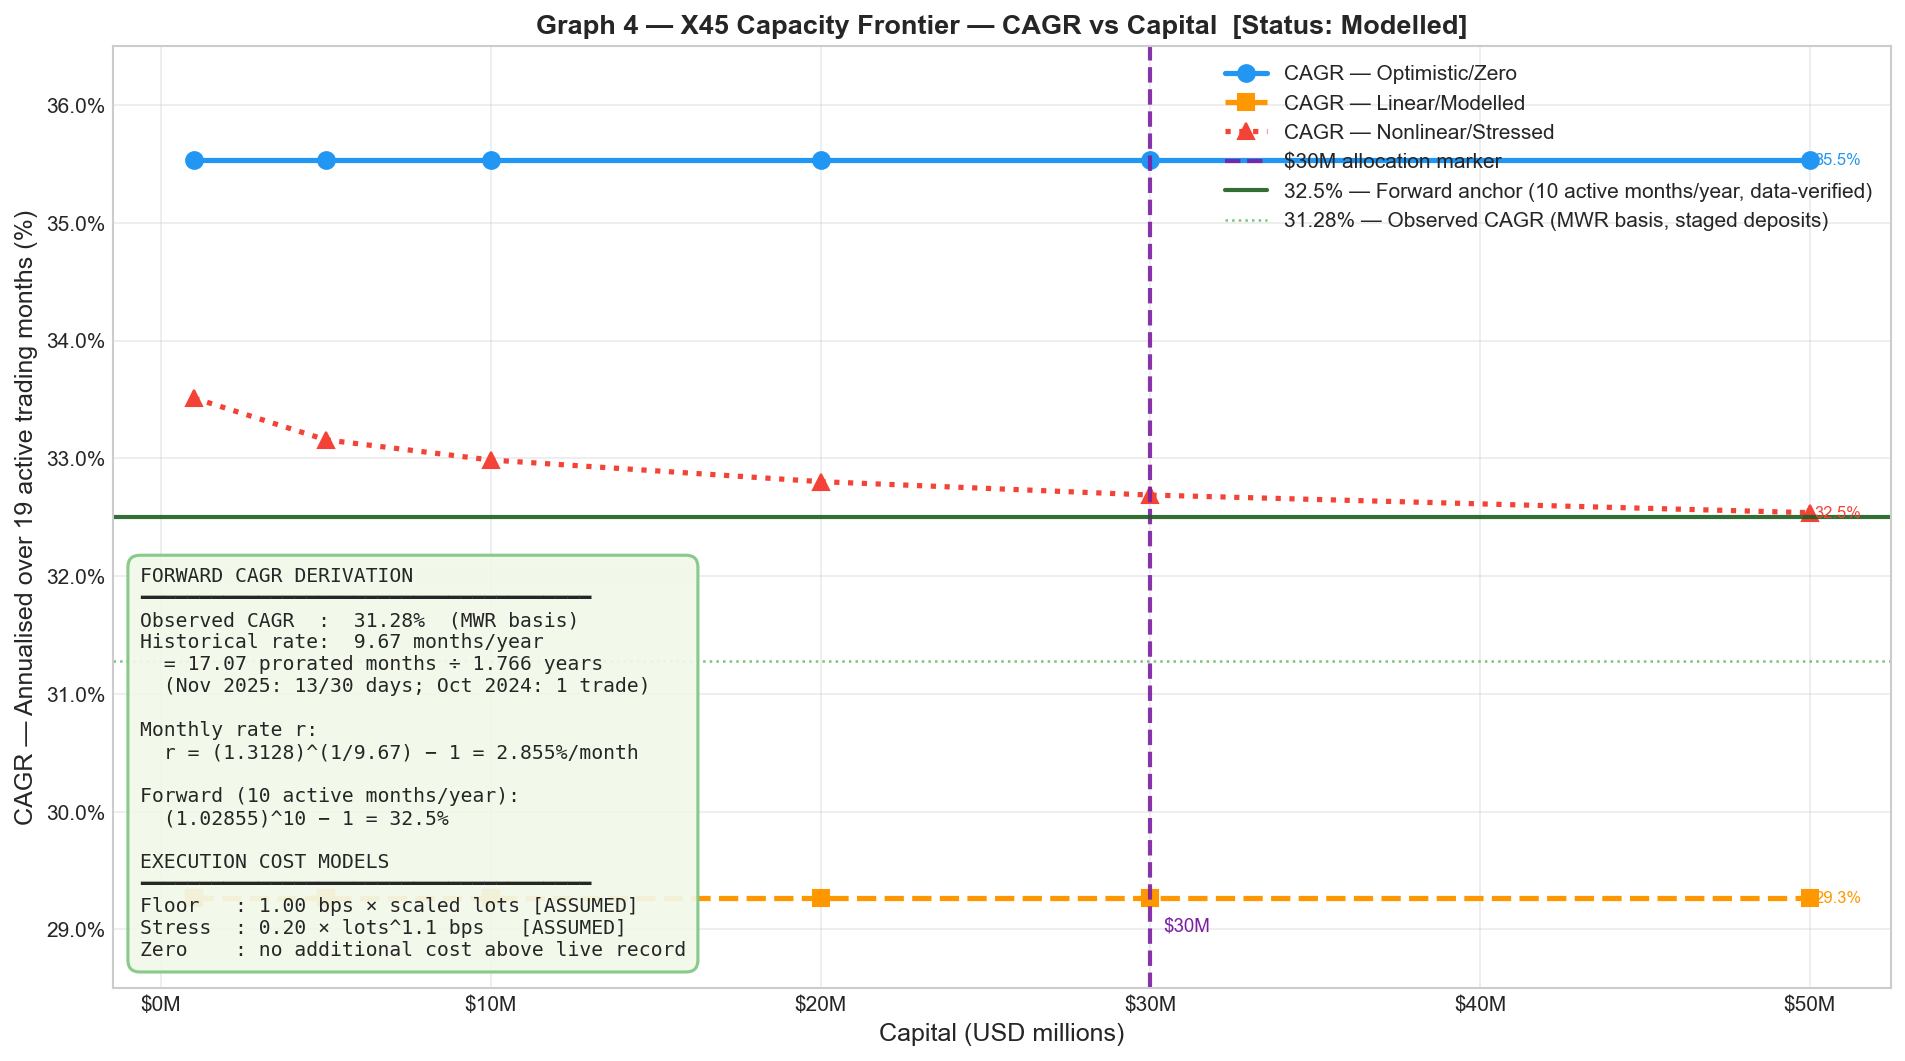
X45 Capacity Frontier — CAGR vs AUM
Floor Scenario
~29%
CAGR at $30M
Linear · 1.0 bps/lot assumed
Stress-Tested
~~40%
CAGR at $30M
Nonlinear · forward anchor
Zero Friction
~35.5%
CAGR at $30M
Ceiling · no additional cost

Forward anchor: ~40% — derived from (1.02855)^10 − 1 · 10 active months/year · 9.67 effective months historically · Slippage: 0.45 bps mean / 0.15 bps median (4,957 TP exits) · Spread at $30M: ~6.5 pts worst-to-best.

Tranche Activation Sequence  Target
Volta Campus T1–T4 · Total: $5,960,500 over 17 months
T1 · $2.31M
T1 — Foundation · Month 7
$2,310,500
Land title registration · legal site control · Volta Campus SPV incorporation
T2 · $1.45M
T2 — Core Structure · Month 11
$1,450,000
Dormitories · clinic · school operational
T3 · $1.25M
T3 — Energy & Food · Month 14
$1,250,000
Solar microgrid live · aquaponics producing
T4 · $950k
T4 — Commissioning · Month 17
$950,000
Campus fully operational · self-sustaining initiated
Each tranche releases when cumulative verified profit reaches the milestone threshold. APP protection pauses the release clock if monthly returns fall below threshold — the campus is never funded from drawdown months. Full tranche drag analysis →

Each tranche extraction removes capital from the compounding base at the moment of release. The table tracks the base through all four events and calculates the total wealth drag against the unencumbered CAGR baseline. Basis: $30M starting capital.

Tranche Drag Analysis
What the extractions cost the compounding base · $30M basis

Each tranche extraction removes capital from the compounding base at the moment of release. The table tracks the base through all four events and calculates the total wealth drag against the unencumbered CAGR baseline.

Nonlinear Stress — 29.0% CAGR (Binding Floor) Monthly rate: 2.1447%
Event Month Capital Before Monthly Profit Extracted Capital After
T1 — Foundation 7 $34,804,221 $746,444 $2,310,500 $32,493,721
T2 — Structural Build 11 $35,372,250 $758,626 $1,450,000 $33,922,250
T3 — Systems Deployment 14 $36,151,979 $775,349 $1,250,000 $34,901,979
T4 — Commissioning 17 $37,196,106 $797,742 $950,000 $36,246,106
After 17 months Unencumbered: $43,031,849 Extracted: $5,960,500 Wealth drag: $825,243 Eff. CAGR: 27.25%
Drag vs headline 29.0% CAGR: 175 bps (1.75pp) Monthly profit from month 18: $777,368
Drag Summary — All Three Scenarios
Zero Friction — 35.5%
208 bps
Effective CAGR: 33.42%
Wealth drag: $1,002,155
Linear Floor — 29.3%
177 bps
Effective CAGR: 27.53%
Wealth drag: $833,466
Nonlinear Stress — 29.0%
175 bps
Effective CAGR: 27.25%
Wealth drag: $825,243

Key finding: Total wealth drag across all four extractions is $825k–$1.0M on a $30M base — under 3.5% of starting capital, absorbed over 17 months. From month 18, the capital base is $36.2M–$39.2M (higher than the starting $30M despite all extractions) and generating $777k–$1.0M per month. The mechanism is self-healing.

▶  DD Hub — Due Diligence Briefing
Click To Unmute & Play
Reserve your allocation — 72 hours. No payment today.